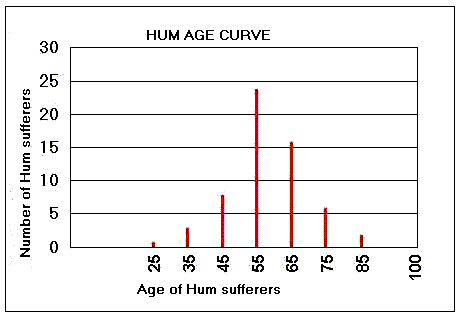
The graph above shows the age distribution of 60 HUM sufferers, 40 female and 20 male.
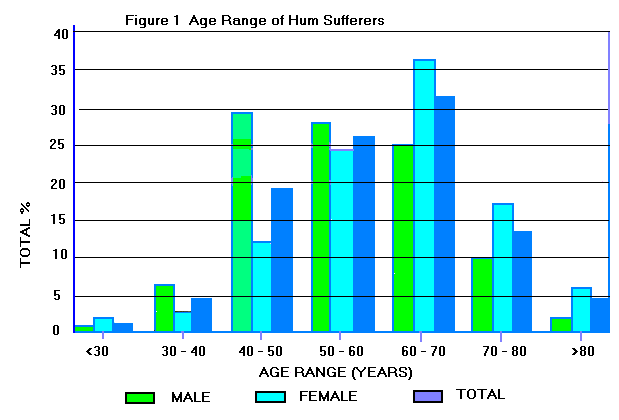
Or alternative age curve by UK government:
AGE DISTRIBUTION OF HUM SUFFERERS
One of the most interesting facts to emerge from a survey of HUM sufferers is a well defined age curve showing that most people begin to hear the HUM around the age of 45 and that the ratio of male to female sufferers is 1/3 male to 2/3 female. Another interesting fact is that some HUM sufferers are either partially or totally deaf.
To date no satisfactory explanation has been given for this. One other peculiarity is that many HUM sufferers "hear" the HUM in the left hand side of the head and those very badly effected obtain a small measure of relief by applying pressure to that side of the head
The graph above shows the age distribution of 60 HUM sufferers, 40 female
and 20 male.
Or alternative age curve by UK government:
AGE DISTRIBUTION OF HUM SUFFERERS

The chart left shows the age distribution of HUM sufferers complied by the Building Research Establishment
The work was carried out on the instructions of the Department of the Environment who paid the Building Research Establishment £50,000 to look into the problem.
BRE subcontracted the work to Sound Research Laboratories of Suffolk.
The work was completed and a report published by Mr J W Sargent in October 1994.
No cause of the Hum was established
Return to Index Page